Automation Projects and Their Debugging
In the previous chapter, we have seen how to use and customize keyboard shortcuts for UiPath environment. This chapter explains how to work with automation projects in UIPath and their debugging methods.
Introduction
UiPath studio provides a complete software solution with the help of which we can automate repetitive and boring back office tasks. It makes our work fast and easy by converting those tedious tasks into UI automation.
Working with Automation Projects in UiPath Studio
Let us discuss about steps that should be followed for making automation projects in UiPath studio along with an example for the same.
As discussed earlier about types of projects in UiPath studio, we can choose any of the project types based on our requirements. When you choose a project type, it would be saved at the default directory location C:\Users\Username\Documents\UiPath with the folder name you provided for that project. This folder consists of the following files −
Main.xml file
This file will hold the main workflow. It is created automatically when we choose a project.
Other .xaml files
While working with a project, it would create many more .xaml files, all of them will be saved in this folder. But all these files must be connected to Main.xaml file because the only file that will be executed is Main.xaml.
.screenshots folder
If we are working with UI automation, then the folder would contain one more folder having screenshots.
Project.json file
All the information about our automation project would be in project.json file.
Steps for Creating an Automation project
Let us understand the creation of an automation project in UiPath studio with the help of a simple example. In this example, the automation project will ask for the name of user and then greet the user with the name. The steps are as follows −
Step 1 − First, we need to open UiPath studio. Then click on the “Start” tab.
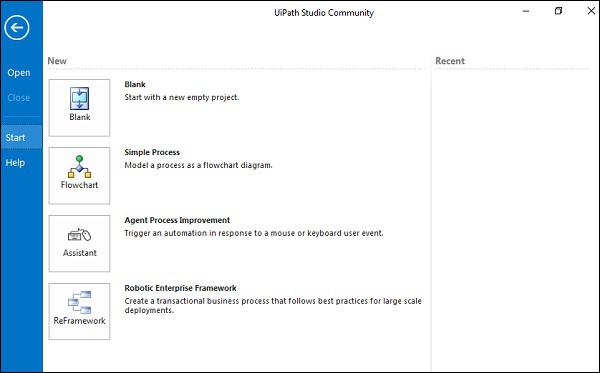
Step 2 − Now, choose “Blank Project” from Blank, Simple process, Agent process improvement and Robotic Enterprise Framework. New project windows will be displayed as follows −

Step 3 − Now, provide the name of the project for example “My First Project” and click on the create button. It will display the UiPath studio interface with workflow for your project as follows −
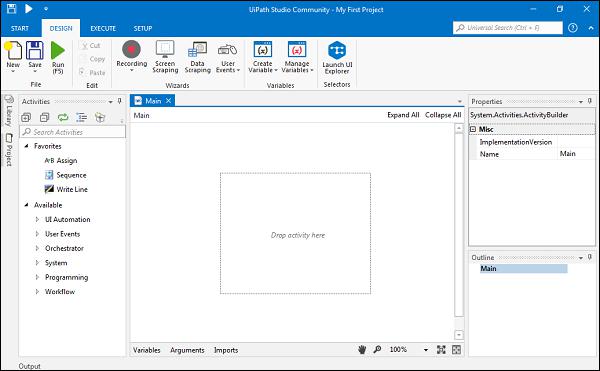
You can see it with the name “My First project” at the top.
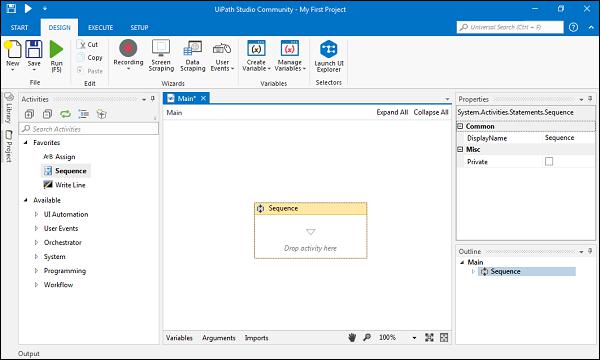
Step 4 − Now, we need to provide activity. You can drag and drop sequence activity from Activity panel to the Designer Panel as shown −
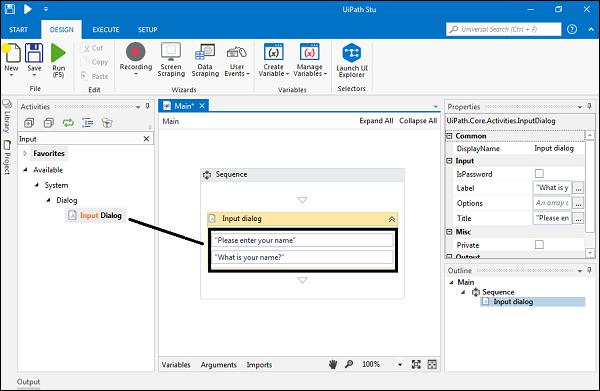
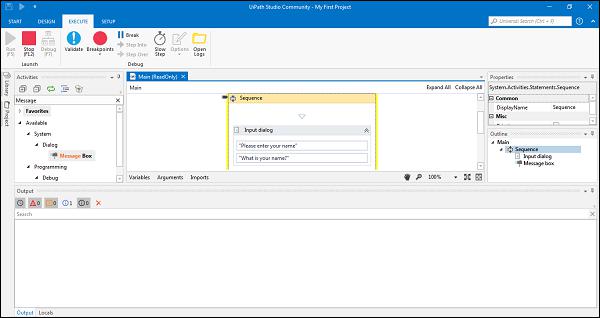
Step 5 − For this particular example, we want our project to ask the name; hence we need to provide Input Dialog to the Sequence activity. Input Dialog can be searched from Activity panel and drag into the Sequence activity as follows −
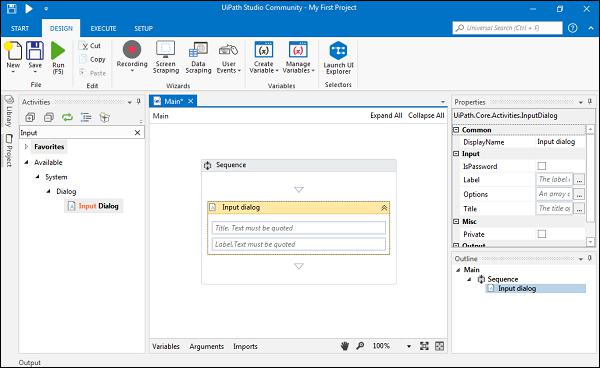
Step 6 − Input dialog has two fields: Title and Label. For Title, we can write “Please enter your name?” and we can write label as “What is your name?” Please note that we must have to enter the text in UiPath studio in double quotes (“ ”).
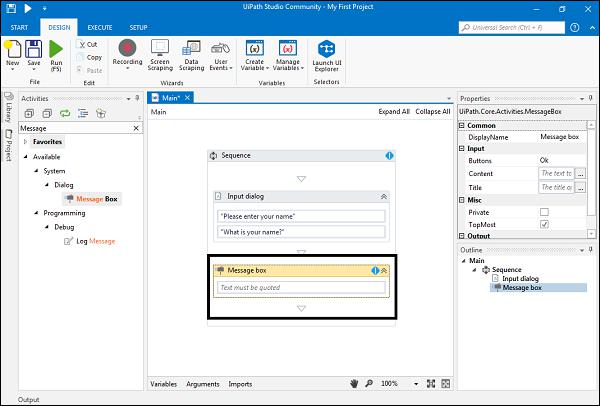
Step 7 − As we said that this automation project will greet the user after asking his/her name. For this we need a message box activity to be added in sequence activity as follows −
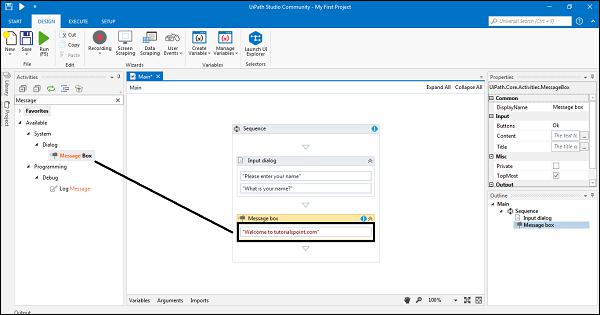
Step 8 − Now, write the message that will be prompted when a user will enter his/her name. For example, we are writing the message “Welcome to howcodex.com!” It must also be in double quotes.
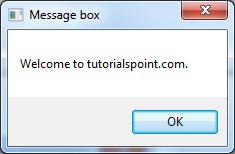
Step 9 − Now, run this program by clicking Run button or pressing F5. It will show a dialog box as follows −
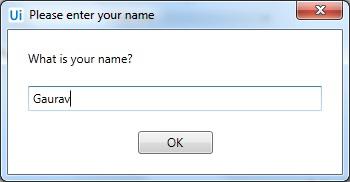
Now write your name and press OK button, it will greet you as follows −
What is Automation Debugging?
Debugging is one of the fundamental elements of automation and programming which may be defined as the process of identifying and removing errors from a given project. UiPath studio has a debug component that helps us to find and locate problems easily in complex workflows. In other words, we can say that UiPath studio debugging component is a powerful functionality that makes us sure that our project is error-free by providing us the information about our project with step-by-step highlighting. We can find all the functions of Debugging under Execute tab.
Functions of Debugging
UiPath Studio provides us the following functions for debugging −
Validate − As we know that validity means the action of checking the accuracy of something. We can check validity of our UiPath automation project, before debugging, by clicking the Validate tab under Execute tab.
Breakpoint − If you want to check the state of your project at a given point then you can use the Breakpoint tab under Execute tab. It basically enables us to pause the execution of a project. Once you trigger a breakpoint, you can stop it by clicking Stop. Go to next step of debugging by clicking Step over or continue the debugging process by clicking Continue Debug.
Break − As the name suggests this action will pause the debugging process at any given moment. You can use it when debugging is in progress.
Step into − As name suggests, this functionality enables us to closely analyze our activities while debugging step-by-step. You can use it when debugging is paused.
Step over − As name suggests this functionality enables us to highlight activity container and debugs the next activity. You can use it when debugging is paused.
Slow Step − As name suggests this functionality enables us to take a closer look at any activity during debugging. Whenever you click on this action, the speed gets changed by one step. This is similar to Step Into but without having to pause the debugging process. You can use it before or during the debugging process.
Options − The options in debugging allows us to have UI elements highlighted during debugging as well as the activities logged in output panel as they are debugged.
We have following under Option tab −
Highlight elements − If you check and enable this option then UI elements will be highlighted during debugging.
Highlight activities − If you check and enable this option then UI activities will be highlighted during debugging.
Log activities − If you check and enable this option then debugged activities will be displayed as Trace logs in the Output panel.
Open Logs − This option opens the folder where logs are locally stored. The location of the folder would be C:\Users\Username\AppData\Local\UiPath\Logs.
Steps for Performing Automation Debugging
We can follow some steps to perform debugging of an automated project −
Step 1 − Open the project you want to debug.
Step 2 − It is recommended to do the validation before debugging. Click on the Validate tab under Execute tab. The following screenshot shows the validation of our automated project of greeting a user by name, implemented as an example recently in this chapter −
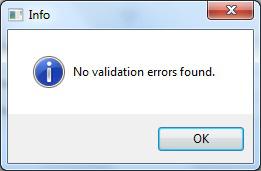
It displays the above message because there was no validation error. Now we can start debugging.
Step 3. Now, click on the Debug button or F7 key under Execute tab to start debugging your project. The following screenshot gives an insight of debugging of our project −
You can notice that it is highlighting the particular activity being debugged. You can also choose from various functions of debugging as discussed above.