Kibana - Working With Region Map
With this visualization, you see the data represented on the geographical world map. In this chapter, let us see this in detail.
Create Index for Region Map
We will create a new index to work with region map visualization. The data that we are going to upload is shown here −
{"index":{"_id":1}}
{"country": "China", "population": "1313973713"}
{"index":{"_id":2}}
{"country": "India", "population": "1095351995"}
{"index":{"_id":3}}
{"country": "United States", "population": "298444215"}
{"index":{"_id":4}}
{"country": "Indonesia", "population": "245452739"}
{"index":{"_id":5}}
{"country": "Brazil", "population": "188078227"}
{"index":{"_id":6}}
{"country": "Pakistan", "population": "165803560"}
{"index":{"_id":7}}
{"country": "Bangladesh", "population": "147365352"}
{"index":{"_id":8}}
{"country": "Russia", "population": "142893540"}
{"index":{"_id":9}}
{"country": "Nigeria", "population": "131859731"}
{"index":{"_id":10}}
{"country": "Japan", "population": "127463611"}
Note that we will use _bulk upload in dev tools to upload the data.
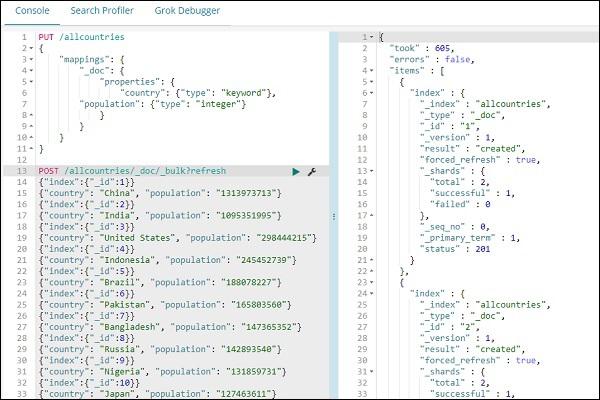
Now, go to Kibana Dev Tools and execute following queries −
PUT /allcountries
{
   "mappings": {
      "_doc": {
         "properties": {
            "country": {"type": "keyword"},
               "population": {"type": "integer"}
         }
      }
   }
}
POST /allcountries/_doc/_bulk?refresh
{"index":{"_id":1}}
{"country": "China", "population": "1313973713"}
{"index":{"_id":2}}
{"country": "India", "population": "1095351995"}
{"index":{"_id":3}}
{"country": "United States", "population": "298444215"}
{"index":{"_id":4}}
{"country": "Indonesia", "population": "245452739"}
{"index":{"_id":5}}
{"country": "Brazil", "population": "188078227"}
{"index":{"_id":6}}
{"country": "Pakistan", "population": "165803560"}
{"index":{"_id":7}}
{"country": "Bangladesh", "population": "147365352"}
{"index":{"_id":8}}
{"country": "Russia", "population": "142893540"}
{"index":{"_id":9}}
{"country": "Nigeria", "population": "131859731"}
{"index":{"_id":10}}
{"country": "Japan", "population": "127463611"}
Next, let us create index allcountries. We have specified the country field type as keyword −
PUT /allcountries
{
   "mappings": {
      "_doc": {
         "properties": {
            "country": {"type": "keyword"},
            "population": {"type": "integer"}
         }
      }
   }
}
Note − To work with region maps we need to specify the field type to be used with aggregation as type as keyword.

Once done, upload the data using _bulk command.
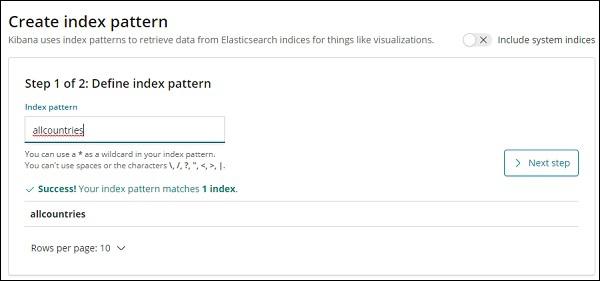
We will now create index pattern. Go to Kibana Management tab and select create index pattern.
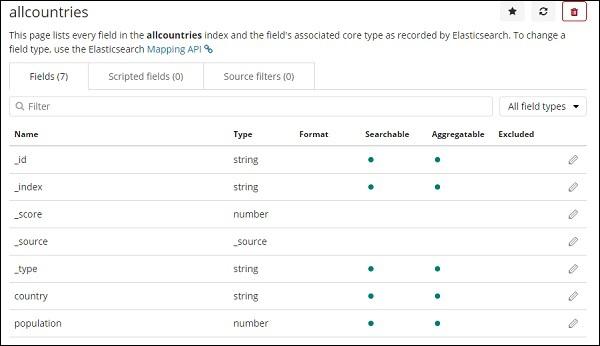
Here are the fields displayed from allcountries index.
Getting Started with Region Maps
We will now create the visualization using Region Maps. Go to Visualization and select Region Maps.
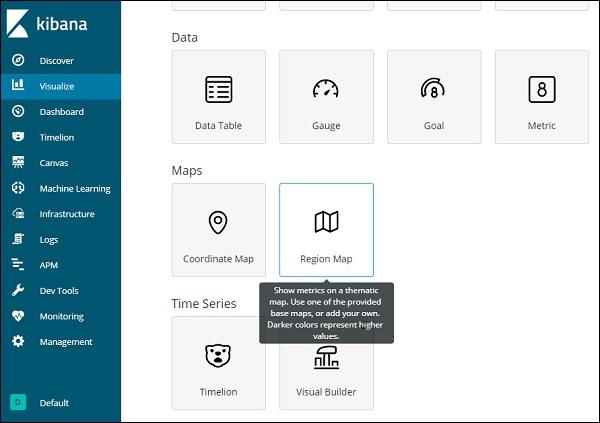
Once done select index as allcountries and proceed.
Select Aggregation Metrics and Bucket Metrics as shown below −
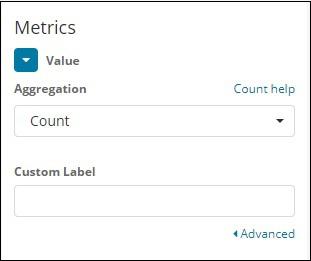
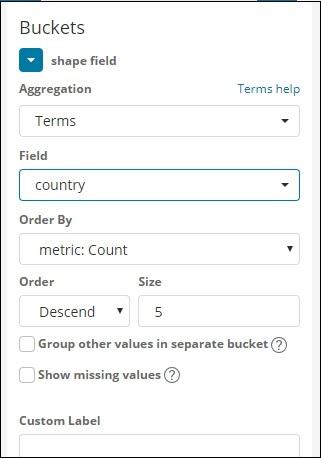
Here we have selected field as country, as i want to show the same on the world map.
Vector Map and Join Field for Region Map
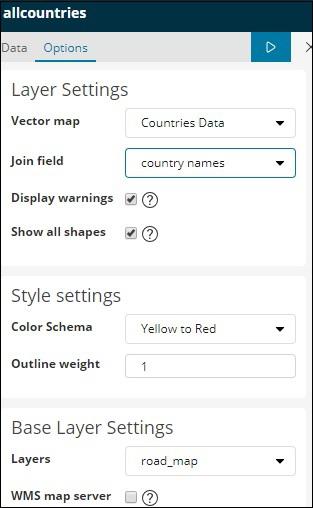
For region maps we need to also select Option tabs as shown below −
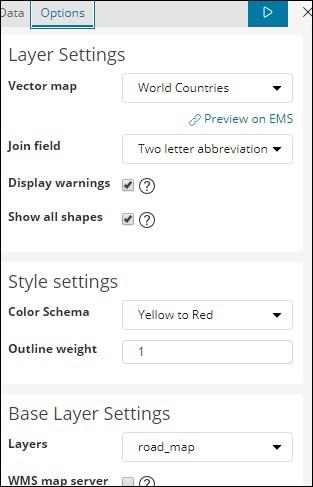
The options tab has Layer Settings configuration which are required to plot the data on the world map.
A Vector Map has the following options −
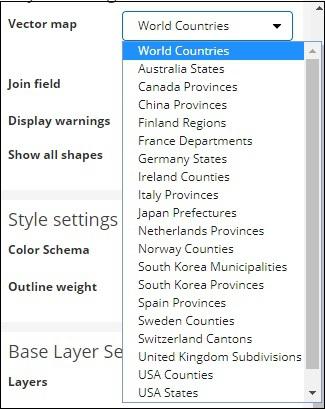
Here we will select world countries as i have countries data.
The Join Field has following details −
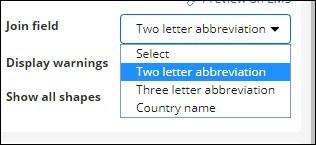
In our index we have the country name, so we will select country name.
In Style settings you can choose the color to be displayed for the countries −
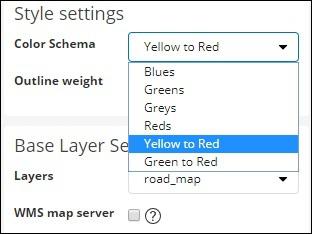
We will select Reds. We will not touch the rest of the details.
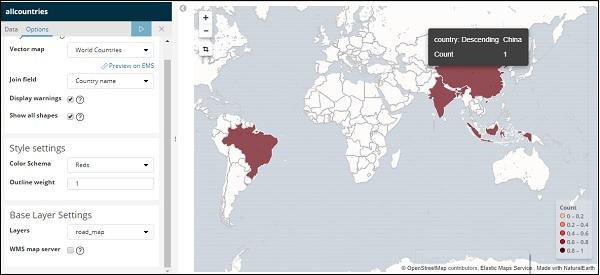
Now,click on Analyze button to see the details of the countries plotted on the world map as shown below −
Self-hosted Vector Map and Join Field in Kibana
You can also add your own Kibana settings for vector map and join field. To do that go to kibana.yml from the kibana config folder and add the following details −
regionmap:
   includeElasticMapsService: false
   layers:
      - name: "Countries Data"
      url: "http://localhost/kibana/worldcountries.geojson"
      attribution: "INRAP"
      fields:
         - name: "Country"
         description: "country names"
The vector map from options tab will have the above data populated instead of the default one. Please note the URL given has to be CORS enabled so that Kibana can download the same. The json file used should be in such a way that the coordinates are in continuation. For example −
https://vector.maps.elastic.co/blob/5659313586569216?elastic_tile_service_tos=agree
The options tab when region-map vector map details are self-hosted is shown below −
