Power Pivot provides you with different combinations of Power PivotTable and Power PivotChart for data exploration, visualization, and reporting. You have learnt the PivotTables and PivotCharts in the previous chapters.
In this chapter, you will learn how to create the Table and Chart combinations from within the Power Pivot window.
Consider the following Data Model in Power Pivot that we will use for illustrations −
With this option, you can create a Power PivotChart and a Power PivotTable, one next another horizontally in the same worksheet.
Click the Home tab in Power Pivot window.
Click PivotTable.
Select Chart and Table (Horizontal) from the dropdown list.
Create PivotChart and PivotTable (Horizontal) dialog box appears. Select New Worksheet and click OK.
An empty PivotChart and an empty PivotTable appear on a new worksheet.
Click on the PivotChart.
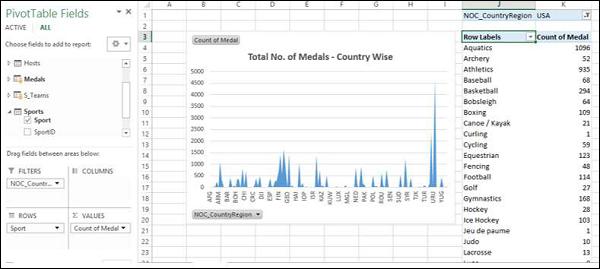
Drag NOC_CountryRegion from Medals table to the AXIS area.
Drag Medal from Medals table to the ∑ VALUES area.
Right click on the Chart and select Change Chart Type from the dropdown list.
Select Area Chart.
Change the Chart Title to Total No. of Medals − Country Wise.
As you can see, USA has the highest number of Medals (> 4500).
Click on the PivotTable.
Drag Sport from the Sports table to the ROWS area.
Drag Medal from the Medals table to the ∑ VALUES area.
Drag NOC_CountryRegion from Medals table to FILTERS area.
Filter the NOC_CountryRegion field to the value USA.
Change the PivotTable Report Layout to Outline Form.
Deselect Sport from the Sports table.
Drag Gender from the Medals table to the ROWS area.
With this option, you can create a Power PivotChart and a Power PivotTable, one below another vertically in the same worksheet.
Click the Home tab in Power Pivot window.
Click PivotTable.
Select Chart and Table (Vertical) from the dropdown list.
The Create PivotChart and PivotTable (Vertical) dialog box appears. Select New Worksheet and click OK.
An empty PivotChart and an empty PivotTable appear vertically on a new worksheet.
Click on the PivotChart.
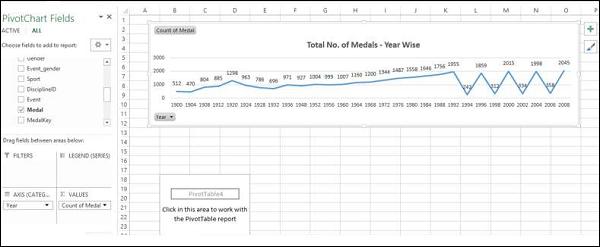
Drag Year from the Medals table to AXIS area.
Drag Medal from the Medals table to ∑ VALUES area.
Right click on the Chart and select Change Chart Type from the dropdown list.
Select Line Chart.
Check the box Data Labels in the Chart Elements.
Change the Chart Title to Total No. of Medals – Year Wise.
As you can observe, year 2008 has the highest number of Medals (2450).
Click on the PivotTable.
Drag Sport from the Sports table to the ROWS area.
Drag Gender from the Medals table to the ROWS area.
Drag Medal from the Medals table to the ∑ VALUES area.
Drag Year from the Medals table to the FILTERS area.
Filter the Year field to the value 2008.
Change the Report Layout of PivotTable to Outline Form.
Filter the field Sport with Value Filters to Greater than or equal to 80.